Is it possible to highlight a change within plankton communities due to ocean eddies?
After 2 months in Antarctica, sailors and scientists left Patagonia and set a course towards South Africa. A month and a half in the open sea between the Southern Ocean and the Atlantic Ocean, including a short 3-day stopover in South Georgia, a British island in the South Atlantic Ocean. This transatlantic crossing of the Tara Microbiome mission aims at highlighting the impact of ocean eddies on the development of plankton populations over time (from a few hours to a few months).
Ocean circulation
Connecting 2 continents by sailing near the Roaring 40s and the Furious 50s (*1) is a true maritime adventure that requires facing raging elements: high winds, gigantic waves and very cold temperatures. These areas are also characterized by strong currents separating ocean regions with very different hydrographic properties. This illustrates the key role of the Southern Ocean in global ocean circulation. As a matter of fact, this latter can be schematized by a large network of ocean currents.
There are different types of structures in the ocean: those near the surface such as the large ocean gyres sadly known for the aggregation of plastics in their center (for instance, the Gulf Stream is one of these branches), and others deriving from slow-moving branches such as large rivers in the ocean depths.
The Southern Ocean is also one of the main routes for the upwelling of deep ocean waters which, after traveling for several hundred years in contact with the seafloor, are “aspirated” towards the surface due to the combined effect of wind and the change in density of the water layer in contact with the atmosphere. Finally, in its southernmost part, this ocean is a source of deep water.

However, a large part of ocean processes are not integrated into this schematic description of large-scale ocean circulation.
In the course of this crossing, the anomalies of this circulation are the main targets of scientists. In particular, ocean eddies will be studied by the Tara team, as well as related turbulent structures of smaller scales. One must distinguish:
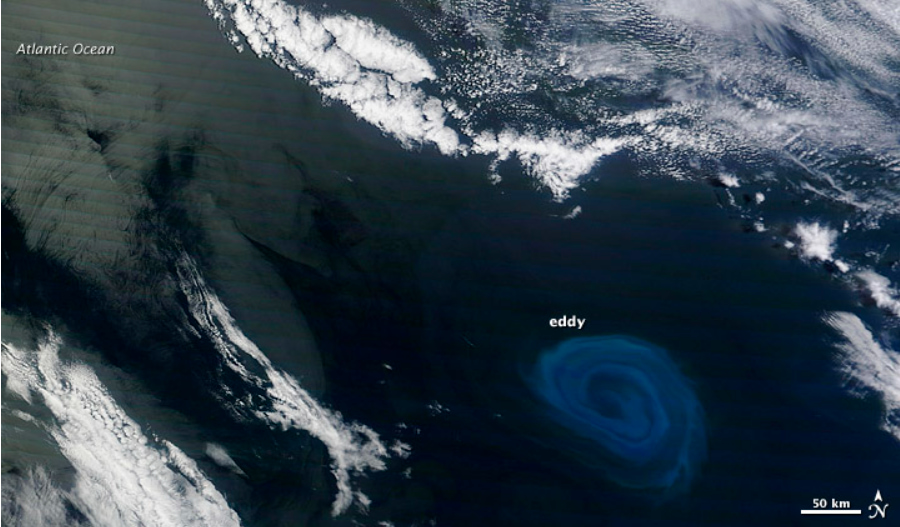
- Ocean eddy: A rounded structure (radius: 20-200 km) that rotates faster around its center than it moves. As a result, water and plankton tend to remain trapped within this structure. Eddies transport water from one region to another, and are therefore characterized by temperatures and salinities that are very different from the ocean in which they move. By transporting water, eddies play a major role in ocean circulation and affect the climate on both regional and global scales.
- Filament: A body of water that, due to nearby dynamic structures, extends along a strong current such as those at the edges of eddies.
- Front: An ocean structure separating 2 bodies of water with different properties.
Edges of eddies are therefore composed of ocean fronts, and so are the boundaries between the various hydrographic regions of the Southern Ocean.
What is an ocean eddy?
There is a significant amount of ocean eddies that, similarly to atmospheric depressions and anticyclones for air, are associated with anomalies of negative water pressures in the event of cyclonic eddies or positive water pressures in the event of anticyclonic eddies.
These pressure differentials lead to the creation of ocean currents, which reach equilibrium by turning around the center of the eddies, due to the Earth’s rotation. Thus, the water particles trapped in an eddy rotate faster around its center (up to a little more than 1 m/s or 2 knots) compared to the eddy’s moving speed (in the order of 10 km/day, i.e. 0.1 m/s).
These structures have a radius of 20 to 200 km depending on the significance of the effect of the Earth’s rotation (and thus of latitude). It is possible to monitor them from a few days to several months, even for some, several years.
What are the properties of these bodies of water?
Each eddy has a particular “signature” depending on its physical properties (temperature and salinity). As previously stated, it is possible to distinguish 2 types of large structures: anticyclones and, in contrast, cyclones.
- In an anticyclone, the water at the center of this structure is less dense (for example, warmer) than the ocean in which it moves. This water therefore occupies a larger volume, which corresponds to a positive pressure anomaly.
- A cyclone is the opposite symmetry, the water at the center of this structure is denser (for instance, colder) than the ocean in which it moves. This water therefore occupies a smaller volume, which corresponds to a negative pressure anomaly.
How do we detect ocean eddies?
The monitoring of sea level differences in bodies of water close to the surface can be carried out from space using altimetry satellites that measure water height.
Clearly, the ocean surface is not flat as a result of waves, but there are also larger-scale differences related to water density. For instance, the surface of the Southern Ocean’s cold waters can be more than 3 m below the level of warm waters east of South Africa and Madagascar. These data can therefore be used to identify changes in density between several bodies of water.
Since eddies are characterized by the density of bodies of water, altimetry data are a gold mine for researchers hoping to detect such structures. For example, anticyclones, which are less dense than the surrounding water, will appear as a rounded bump of several centimeters compared with their environment. In addition, the chronological study of these images produced every day allows scientists to track the movement of ocean eddies.
What is studied aboard the schooner Tara during the transatlantic crossing?
The transatlantic crossing allows significant modification of the schooner’s intended route in order to follow particular bodies of water.
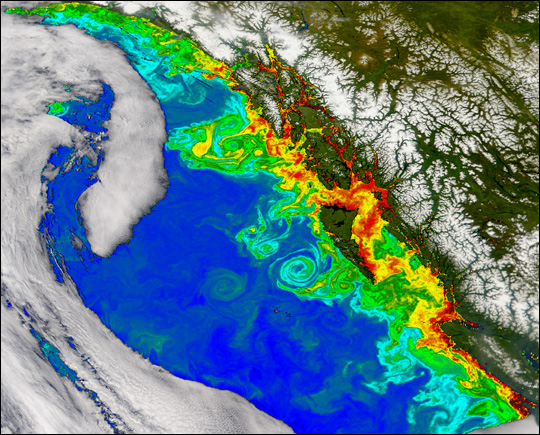
Using satellite images analyzed daily on board, scientists identify different ocean structures (eddies and fronts) that they then target for sampling aboard Tara. The aim is to study the link between these dynamic structures visible on satellite images and the entanglement of biological communities that only on-site sampling can characterize.
The scientific team relies on previous scientific studies suggesting that an eddy characterized by stable hydrological conditions (temperatures, salinity) is composed of a low diversity of organisms. Indeed, marine species that are best adapted to the environment are expected to be predominant, causing biodiversity loss. On the contrary, front-type structures are exchange zones where physicochemical and biological properties change rapidly, not allowing communities to dominate, therefore diversity of species should be higher.
Tara’s scientists intend to verify that competition between plankton groups is greater in eddy-type structures than in front-type structures, and that therefore plankton diversity is greater in front-type structures.
What is the sampling strategy used in an eddy?
In essence, a sampling plan can only be an optimal strategy in the event that all the conditions, mainly meteorological but also material, allow the plan to be properly implemented.
In order to characterize the area of an oceanic eddy, the sampling plan is established over 10 days with a strategy based on 3 types of actions:
- stations: Tara remains at the same location and performs hydrographic and biological measurements
- transects: Tara sails from point A to point B
- mappings (duration: 36 h) Tara carries out continuous measurements in the eddy.
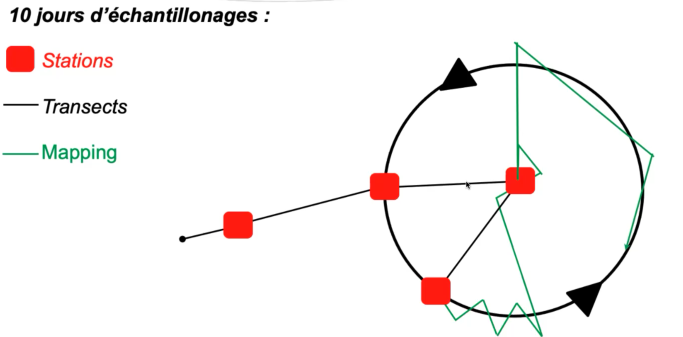
10-day sampling planning
To achieve a complete and comprehensive monitoring, sampling will be performed in an alternating sequence of sampling cycles (stations) and mappings (continuous 36-hour sampling). To define the area to be studied, scientists constantly analyze satellite data.
A first station is performed outside the eddy, then a second targets the “front”, i.e. the edge of the structure. Drifters — drifting buoys floating freely — are deployed in the ocean to measure currents around the stations and determine the displacement speed of the body of water sampled at a given moment. A third station is performed at the center of the eddy. Researchers can then compare the biodiversity present in the samples from station 2 (front) to that of station 3 (eddy). In addition to drifters, between 2 sampling stations, a 36-hour mapping is carried out to characterize the area.
This sampling cycle and then characterization of the area occur over the 10-day study.
Article cowritten with Rémi Laxanaire, a postdoctoral research associate at the University of Reunion Island and scientific leader during the Tara Microbiome mission
Notes :
Gyres and eddies are very different structures that shouldn’t be confused. Even though both are characterized by rotating water movements, gyres are stable in position (unlike eddies that can cross the ocean) and wind-forced (for instance, the Gulf Stream is the western branch of the North Atlantic subtropical gyre). Gyres are much larger than eddies: several 1,000 km compared to several tens to a few hundred km for eddies.
* 1: Names given, respectively, to winds and, by association, to the latitudinal band of a zone. Thus, the Roaring 40s characterize winds between the 40th and 50th parallels south. Likewise, the Furious 50s are between the 50th and 60th parallels south. These areas are characterized by strong winds and a particularly raging sea.
Microbiome mission: Tara studies the Brazilian coasts
Tara studied the Brazilian coasts between September and November 2021 and made 5 awareness-raising stopovers.